- August 28, 2026
- 2025 , Publications
- Comments : 0
Annual PSC Report 2025
INTRODUCTION
DBS has continuously strived throughout its years of operation to adapt to, and positively influence, the Shipping Industry by evaluating and implementing the Rules and Regulations established by International Bodies, as well as its own Class and Recognized Organization Rules.
It is DBS’s mission to enhance the safety of life, property and the environment at sea through the provision of classification, statutory certification and verification of greenhouse gas emissions through the provision of quality-oriented services and the application of recognized standards supported by sound technical judgment.
With this mission in mind, all Departments of DBS collaborate to achieve these objectives. The PSC Department as a branch of the Marine Department of DBS continuously develops new tools and methods using past experience and data in order to better prepare vessels for PSC Inspections and bring them to a standard that minimizes the risk of adverse outcomes during inspections by local Authorities.
In the following pages, the reader can find the DBS PSC Annual Report for the year 2025, presented both in text and by graphical means. This Technical Publication has been issued annually for several years now and the purpose of it is for all readers to be able to comprehend in simple terms the PSC overall performance year to year.
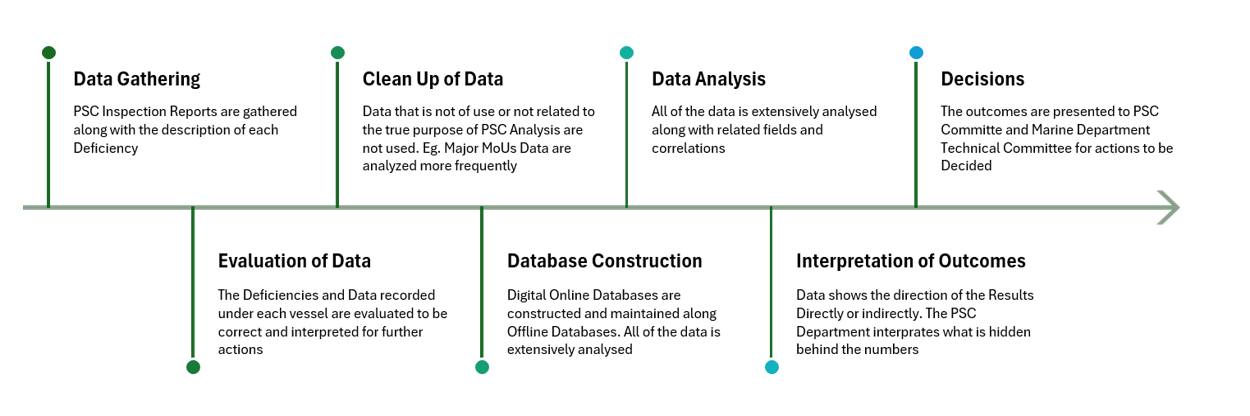
PROCESS OF DECISION-MAKING
INSPECTIONS AND DEFICIENCIES
 The statistical analysis presented in this report primarily covers the six principal PSC regimes monitored by DBS: the Paris, Tokyo, Black Sea, Mediterranean, Abuja and Indian Ocean MoUs. PSC inspection reports from the Caribbean MoU, the Viña del Mar Agreement and the Riyadh MoU are also reviewed where data are available, however, the available data are currently insufficient for detailed statistical comparison.
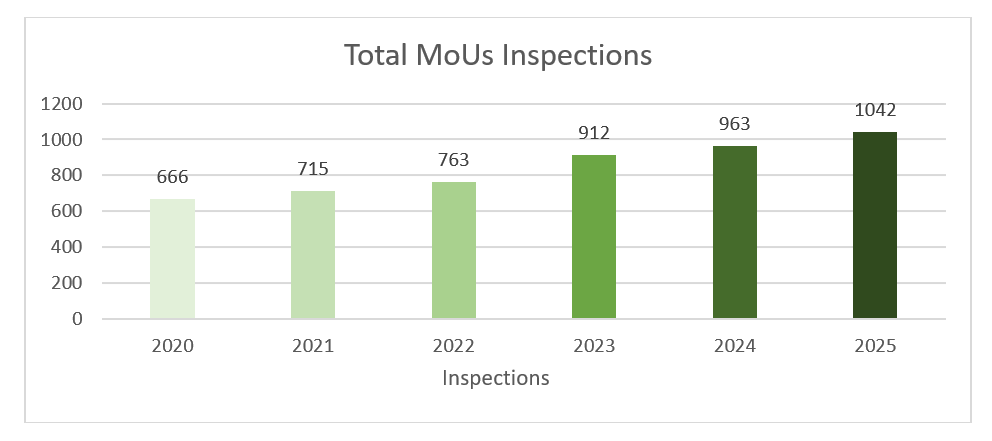
Across the MoUs included in this analysis, the number of PSC inspections increased from 963 in 2024 to 1,042 in 2025, representing an increase of approximately 8.2%. This increase appears to be attributable, in part, to the fact that the same vessels may trade between different MoUs, resulting in inspections being recorded under two or even three MoUs during 2025. The largest increase in MoU inspection numbers was identified in the Mediterranean MoU in 2025, where the number of Detentions also increased disproportionately.
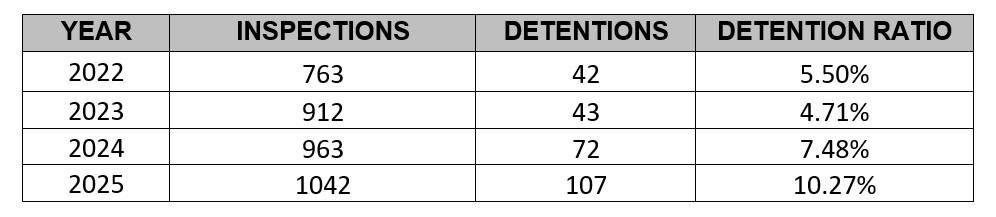
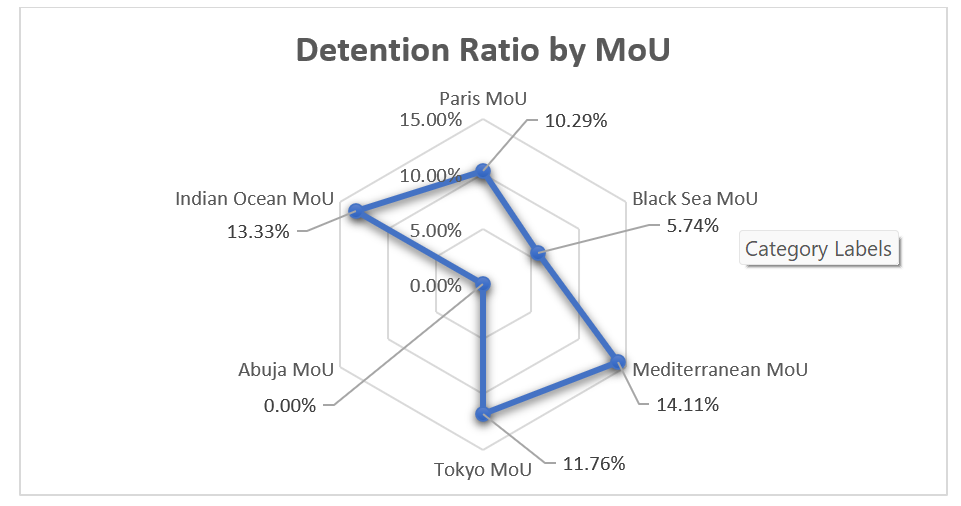
Analysis of the Inspections indicates that the average number of Detainable Deficiencies has increased in 2025 by 0.56 Detainable Deficiencies per Inspection. Compared with the three-year average for 2022–2024 the increase is 0.52 Detainable Deficiencies per Inspection. The spike is located in 2025 where when a ship is detained the number and severity of identified deficiencies is deemed to be more serious and thus resulting deficiencies average to increase both in appearance but also in respect to if they are detainable.
SUMMARY OF DETAINABLE DEFICIENCIES
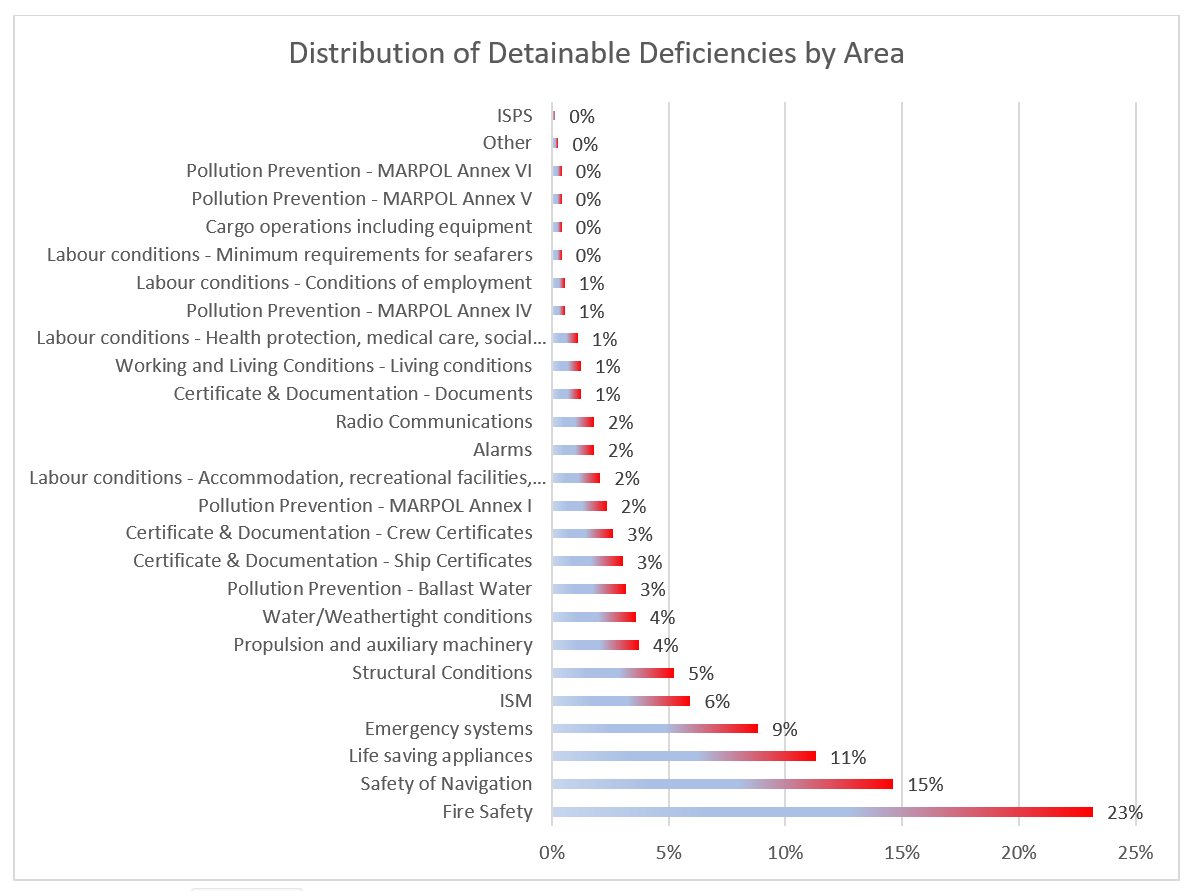
The effect of severity can be also identified on the above chart showing the cumulative frequency of detainable deficiencies. It is observed that the Deficiencies shift to the already highly common identified detainable deficiencies. The skewness to the top Deficiency Areas seems to reduce rest of Area of Deficiencies below the general average and in some cases even eliminate the Appearance of entire Area of Deficiencies.
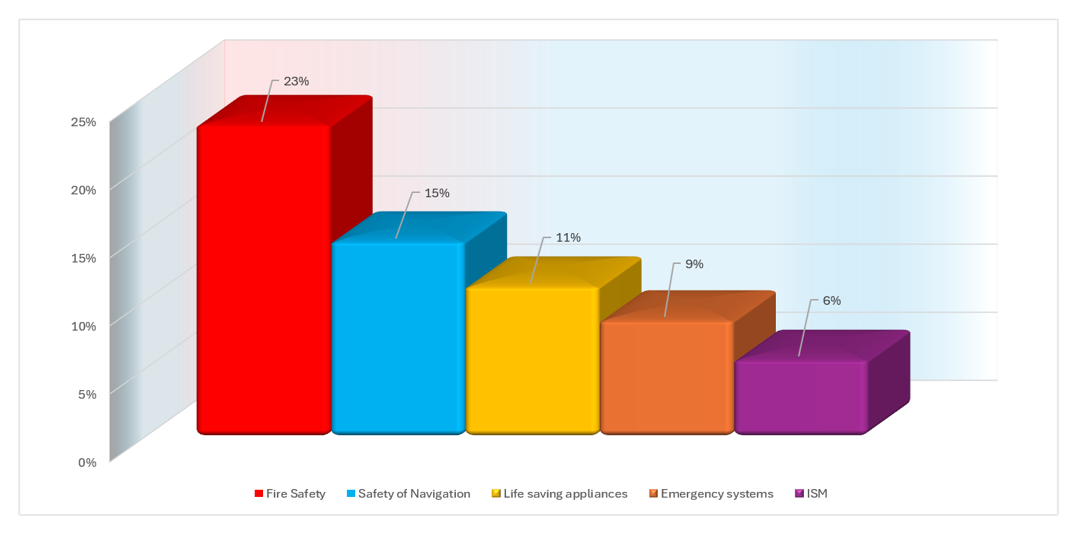
The areas with the highest detainable ratios are presented below, along with the percentage of their occurrence:
• Fire Safety 23%
• Safety of Navigation 15%
• Life-Saving Appliances 11%
• Emergency Systems 9%
• ISM 6%
These five categories accounted for 64% of all detainable deficiencies recorded in 2025. Fire Safety and Life-Saving Appliances increased their share compared with 2023, while Safety of Navigation returned to its 2023 level after decreasing in 2024. The results demonstrate that preventive action should remain focused on the principal safety-related deficiency categories.
The top 5 deficiencies:
Fire Safety:
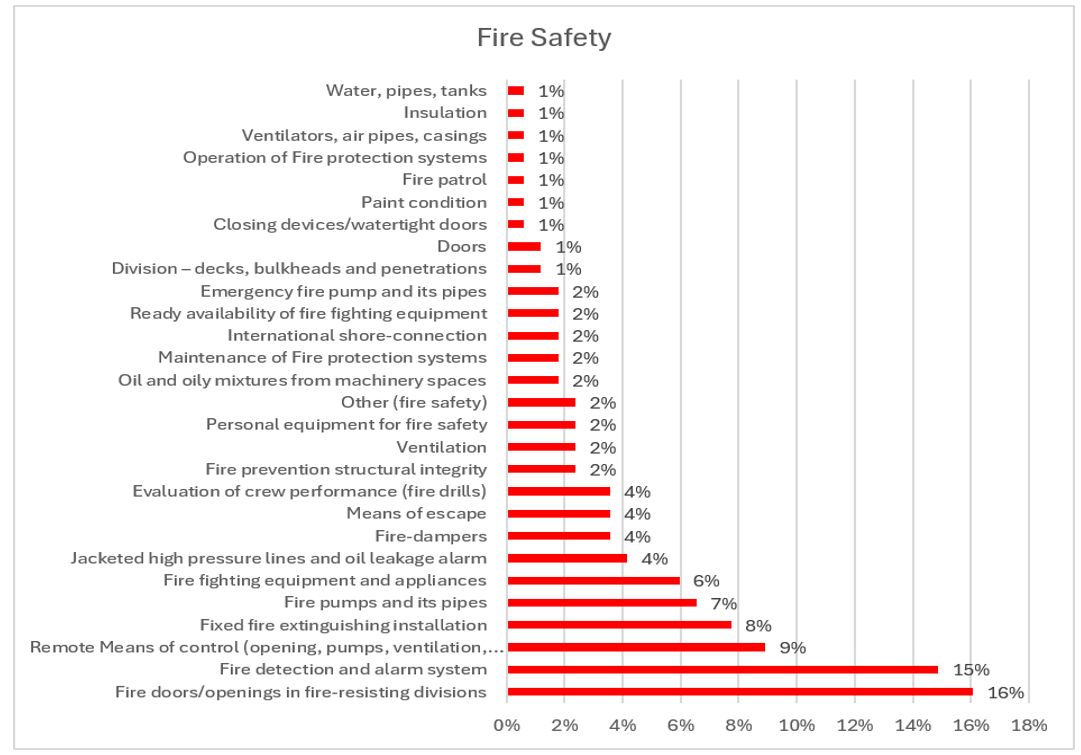
Fire Safety remained the most significant detainable deficiency category during 2025, accounting for the highest proportion of deficiencies identified during PSC inspections. The most frequent deficiencies were related to Fire doors/openings in fire-resisting divisions at 16% and Fire detection and alarm systems at 15%, which together represented almost one-third of all Fire Safety deficiencies. Significant findings were also recorded in Remote means of control at 9%, Fixed fire extinguishing installations at 8%, Fire pumps and associated piping at 7%, and Fire-fighting equipment and appliances at 6%. Deficiencies associated with Jacketed high-pressure fuel lines and oil leakage alarm systems at 4%, Fire dampers at 4%, Means of escape also at 4%, and Evaluation of crew performance during fire drills at 4% also remained notable, highlighting the continued importance of an effective maintenance programme and crew familiarization. The remaining deficiencies were distributed across a range of items, including structural fire protection, ventilation systems, fire prevention arrangements, personal fire safety equipment and emergency preparedness, each contributing between 1% and 2% of the total. The findings indicate that most Fire Safety deficiencies could be prevented through systematic implementation of the Planned Maintenance System (PMS), regular testing of fire detection and extinguishing systems, effective inspection of fire boundaries and closures, and realistic onboard emergency drills
Safety of Navigation
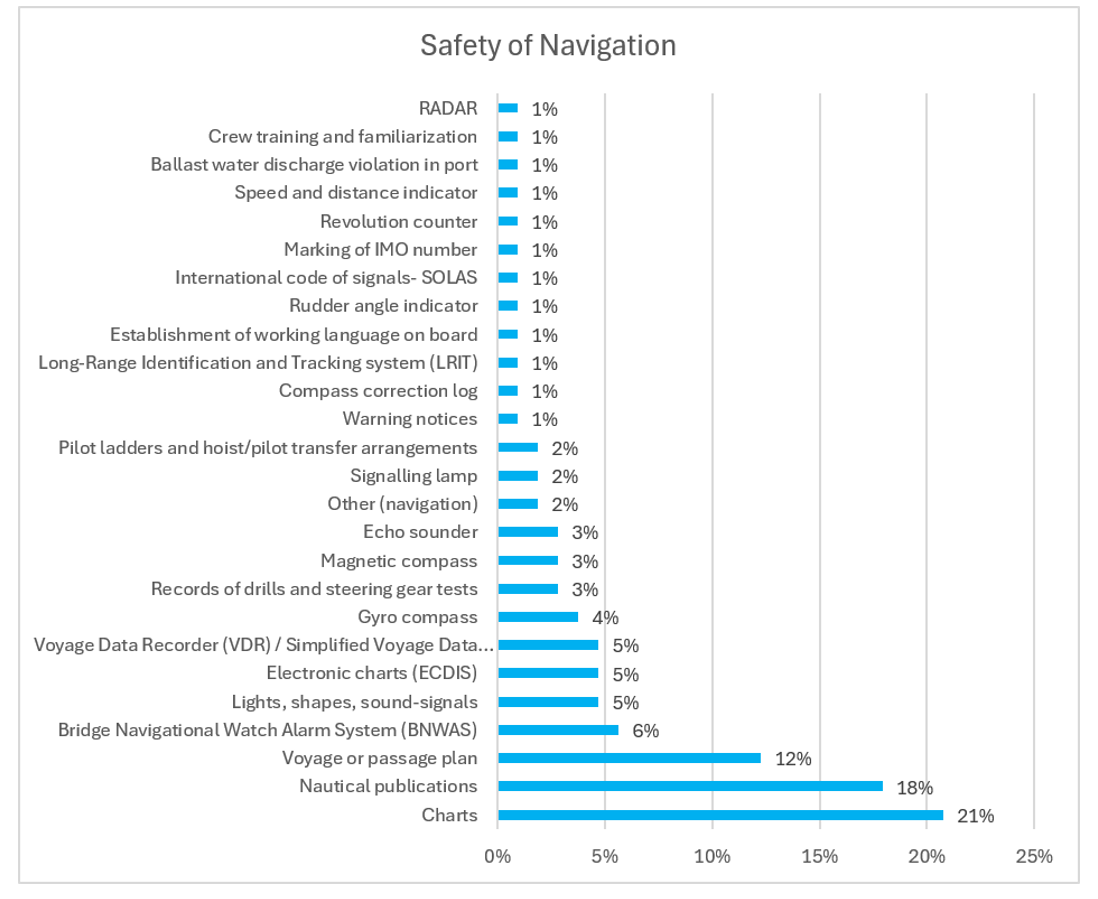
Safety of Navigation continued to represent one of the most significant deficiency categories identified during Port State Control inspections in 2025. The highest proportion of deficiencies was associated with Charts at 21%, followed by Nautical publications at 18% and Voyage or passage planning at 12%, indicating that navigational documentation, voyage preparation and passage planning remain the principal areas of concern. Deficiencies related to the Bridge Navigational Watch Alarm System (BNWAS) at 6%, and Electronic Chart Display and Information System (ECDIS), Voyage Data Recorder (VDR/S-VDR), and Lights, Shapes and Sound Signals each accounted for 5%. Additional deficiencies were identified in Gyro compass at 4%, Magnetic compass at 3%, Echo sounder also at 3%, and Records of drills and steering gear tests also at 3%, while the remaining findings were distributed across various navigational equipment, procedures and statutory requirements, each accounting for between 1% and 2% of the total. The predominance of deficiencies related to navigational documentation and voyage planning demonstrates that many findings can be prevented through effective bridge resource management, systematic verification of nautical publications and charts, proper passage planning, routine testing of navigational equipment and enhanced familiarization of bridge personnel. Emphasis should therefore be placed on pre-arrival bridge checks and internal navigational audits to minimize the risk of PSC deficiencies and improve overall navigational safety.
Life Saving Appliances
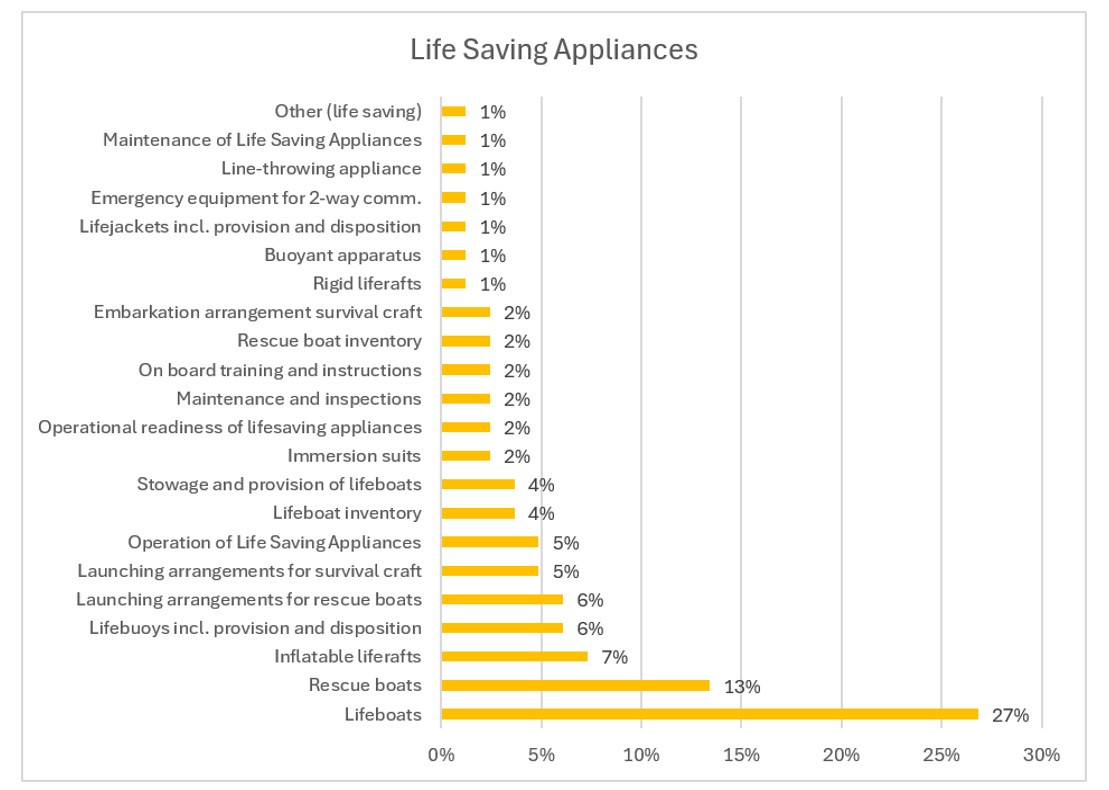
Life Saving Appliances remained one of the principal deficiency categories identified during Port State Control inspections in 2025, with the majority of findings concentrated in a relatively small number of critical items. Lifeboats at 27% accounted for the highest proportion of deficiencies, followed by Rescue boats at 13%, highlighting the continued importance of ensuring that survival craft are maintained in full operational readiness. Significant deficiencies were also identified in Inflatable liferafts at 7%, Lifebuoys including provision and disposition at 6%, and Launching arrangements for rescue boats also at 6%, indicating that maintenance and operational readiness of life-saving appliances continue to present challenges across the fleet. Additional findings were associated with Launching arrangements for survival craft at 5%, Operation of Life Saving Appliances at 5% too, Lifeboat inventory at 4%, and Stowage and provision of lifeboats at also 4%, while the remaining deficiencies were distributed among maintenance, inspections, onboard training, immersion suits, operational readiness and other statutory life-saving requirements, each accounting for between 1% and 2% of the total. The concentration of deficiencies within survival craft and launching arrangements demonstrates that these areas should remain a priority during routine maintenance, annual surveys and onboard inspections. Particular emphasis should be placed on the operational testing of lifeboats and rescue boats, verification of launching appliances, inspection of release mechanisms, and regular crew training and abandon-ship drills to ensure both regulatory compliance and the effective performance of life-saving equipment in an emergency.
One notable finding from the 2025 analysis is that 40% of all Life Saving Appliance deficiencies are concentrated in just two items—Lifeboats at 27% and Rescue Boats at 13%. When Inflatable Liferafts at 7%, Lifebuoys at 6%, and Launching Arrangements for Rescue Boats also at 6% are included, the top five deficiency items account for nearly 60% of all Life Saving Appliance deficiencies. This indicates that targeted preventive maintenance, enhanced testing of survival craft systems, and improved crew familiarization in these specific areas could significantly reduce the overall number of PSC deficiencies within the Life Saving Appliances category.
Emergency Systems
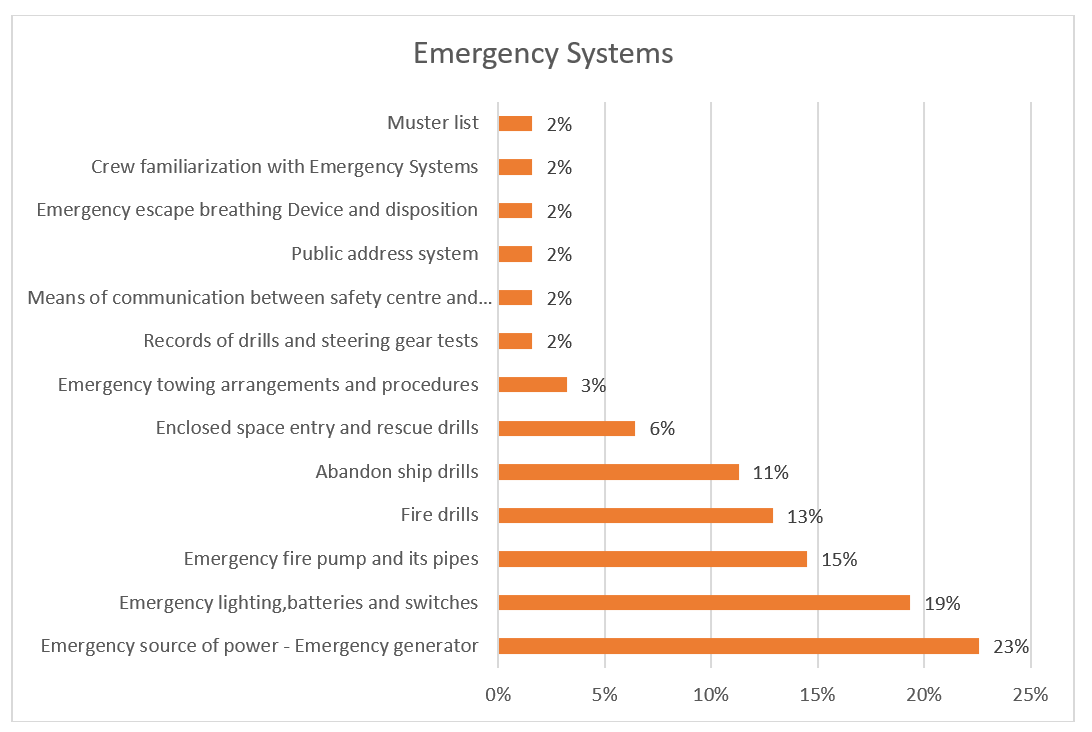
Emergency Systems continued to represent a significant area of concern during Port State Control inspections in 2025, with deficiencies predominantly associated with emergency power generation, emergency lighting and emergency preparedness. The highest proportion of deficiencies was recorded in the Emergency source of power – Emergency generator with 23%, followed by Emergency lighting, batteries and switches at 19%, confirming that the reliability of emergency electrical systems remains one of the principal PSC focus areas. Significant findings were also identified in Emergency fire pumps and associated piping with 15%, Fire drills at 13%, and Abandon ship drills at 11%, indicating that both equipment functionality and crew emergency preparedness continue to require enhanced attention. Additional deficiencies were related to Enclosed space entry and rescue drills at 6% and Emergency towing arrangements and procedures at 3%, while the remaining findings, each accounting for approximately 2% of the total, were distributed among emergency communications, emergency escape breathing devices (EEBDs), ballast water management documentation, muster lists, crew familiarization, steering gear test records and other emergency preparedness requirements. The concentration of deficiencies within emergency power systems and emergency preparedness demonstrates that these areas should remain a priority during routine maintenance, statutory surveys and onboard verification. Particular emphasis should be placed on periodic testing of emergency generators under operational load, verification of emergency lighting systems and battery condition, testing of emergency fire pumps, and the conduct of realistic emergency drills to ensure that both equipment and crew can respond effectively under emergency conditions.
The 2025 results show a particularly strong concentration of deficiencies within a small number of critical systems. Emergency Generator with 23% and Emergency Lighting at 19% together account for 42% of all Emergency Systems’ deficiencies. When Emergency Fire Pump of 15%, Fire Drills of 13%, and Abandon Ship Drills of 11% are included, the top five deficiency items represent almost 80% of the entire Emergency Systems category. This concentration indicates that a focused preventive program targeting emergency electrical systems, emergency firefighting equipment and crew emergency response training would have the greatest impact on reducing PSC deficiencies in this category. Regular functional testing under realistic operating conditions, together with effective onboard drills and verification of emergency procedures, should therefore remain a priority for both shipboard personnel and shore management.
ISM
International Safety Management (ISM) deficiencies identified during Port State Control inspections in 2025 continued to demonstrate that the effective implementation of the Safety Management System (SMS) remains fundamental to achieving and maintaining regulatory compliance. Although ISM deficiencies generally represent a smaller proportion of overall findings than technical deficiency categories, they often reflect systemic weaknesses that contribute to recurring deficiencies in areas such as Fire Safety, Life Saving Appliances, Emergency Systems and Safety of Navigation. The most common ISM-related deficiencies were associated with the implementation of shipboard procedures, maintenance planning, corrective action processes, internal audits, crew familiarization and effective management oversight. These findings suggest that, in many cases, deficiencies are not solely attributable to equipment failures but rather to shortcomings in the effective implementation, monitoring and verification of the Safety Management System. Shipping companies should therefore continue to strengthen the effectiveness of their internal audits, ensure timely corrective actions following inspections, improve onboard verification of planned maintenance activities and enhance crew familiarization with company procedures. A proactive safety culture, supported by effective management commitment and continuous monitoring of SMS implementation, remains one of the most effective measures for reducing PSC deficiencies and preventing vessel detentions.
PSC INSPECTION OUTCOMES
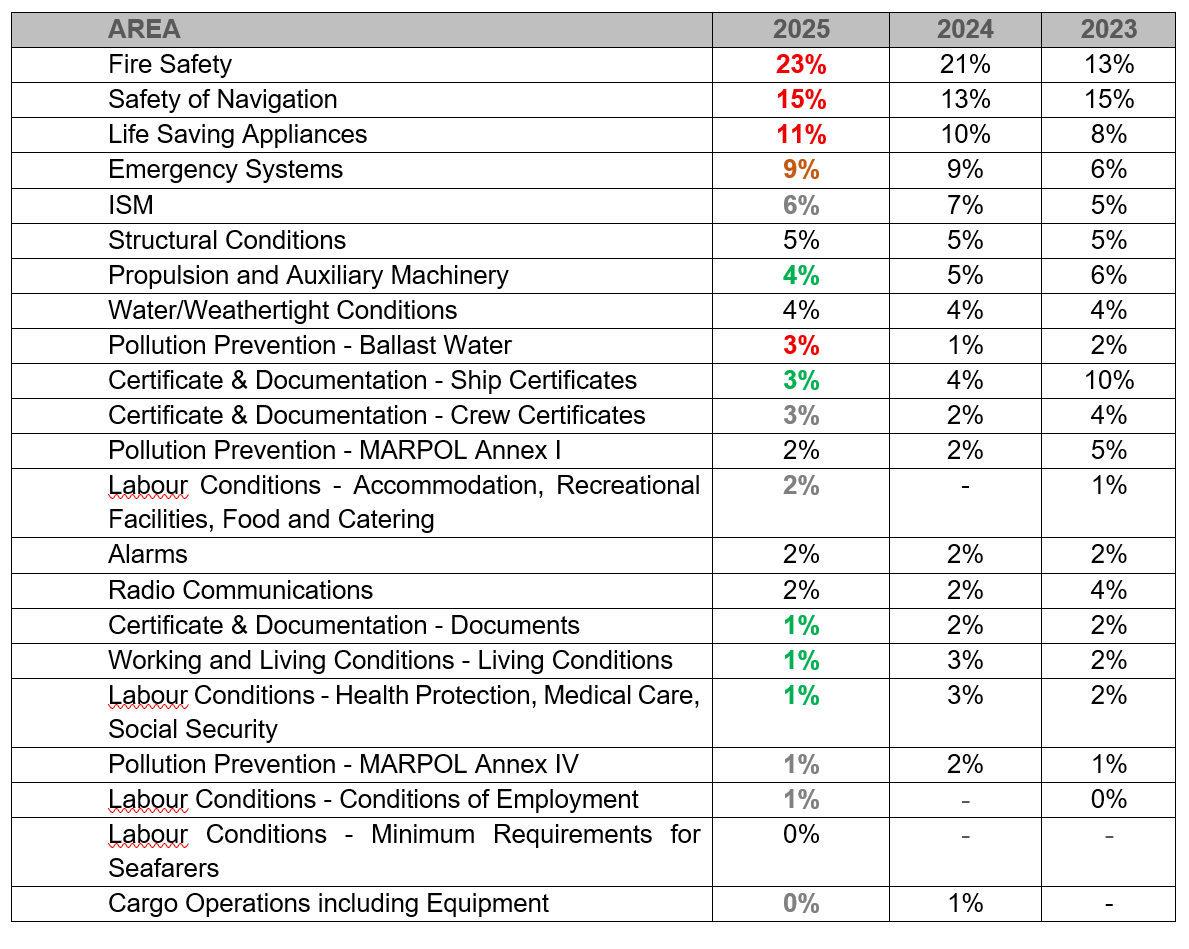
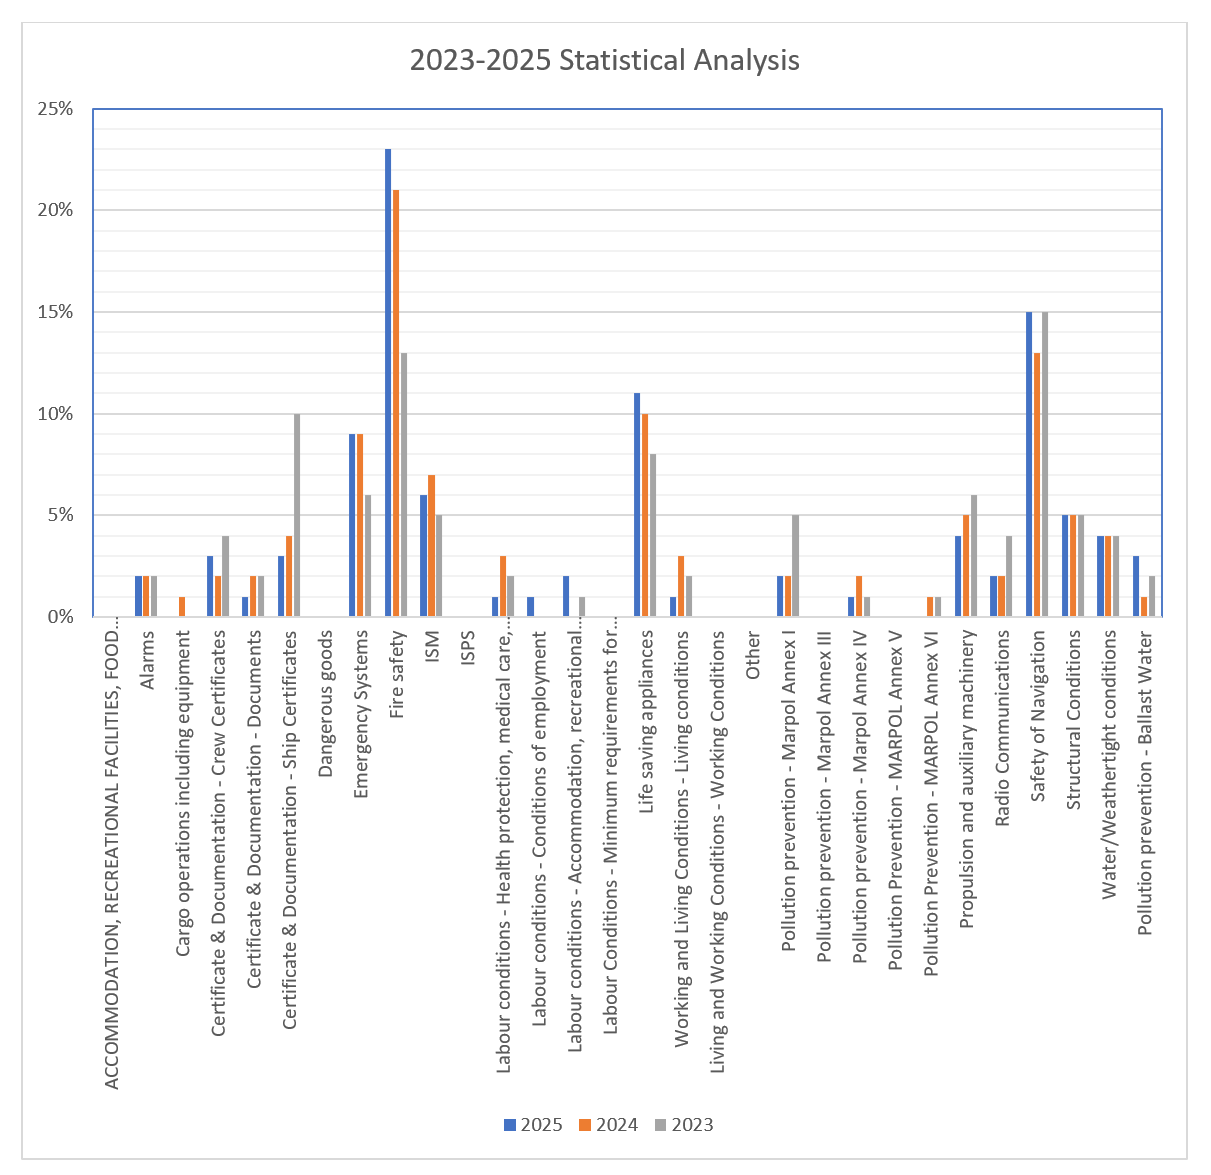
The table and graph present the distribution of detainable deficiencies recorded during the period from 2023 to 2025. The results demonstrate an increasing concentration of detainable deficiencies within the leading categories, particularly Fire Safety, Safety of Navigation, Life-Saving Appliances and Emergency Systems. This concentration indicates that focused preventive measures in these areas are likely to have the greatest impact on overall PSC performance.
Most other deficiency categories either decreased slightly or remained relatively stable, with Pollution Prevention – Ballast Water showing a moderate increase. The distribution across the different MoUs generally follows a similar pattern, confirming that the leading safety-related categories remain principal areas of focus during PSC inspections. Targeted preventive action in these areas is therefore expected to have the greatest effect on improving overall PSC performance.
KEY PRIORITIES FOR 2026
In light of the 2025 PSC findings, enhanced attention should be directed towards Fire Safety, Safety of Navigation, Life-Saving Appliances, Emergency Systems and the effective implementation of the Safety Management System.
Shipowners and managers are expected to ensure the systematic maintenance of critical equipment, effective crew familiarization, realistic emergency drills and robust pre-arrival verification. Particular emphasis should be placed on eliminating recurring deficiencies and demonstrating continuous compliance with applicable international conventions, statutory requirements and recognized safety-management standards.
DROMON CIC ON FIRE SAFETY
The Dromon Bureau of Shipping Concentrated Inspection Campaign targets specific items that have high percentages in the list of detentions. The checklist, which has been developed to enhance preparation for PSC Inspections, should be completed by DBS surveyors during their attendance on board for compliance and readiness of the vessels. This comprehensive and targeted checklist will be used from June 1st to August 31st, 2026.
The outcomes of the campaign will subsequently be evaluated against PSC Inspection results to assess its effectiveness.
THE NEW PARIS MOU RO ATTRIBUTION METHODOLOGY
The ‘RO Responsibility’, which was previously assigned manually by a PSCO for each Detainable Deficiency, has been replaced by a new methodology that directly links the Detainable Deficiency to the RO that issued or endorsed the relevant statutory Certificate.
Under the new methodology, an RO’s average detention rate over a given period (typically three years) will be assessed against the overall average detention rate. Their categorization will be determined as follows:
• High Performance: The detention rate is better than the overall average.
• Medium Performance: The detention rate is equal to or worse than the overall average.
• Low Performance: The detention rate is at least twice the overall detention average.
In order to be able to implement the new approach on 6 July 2027, the linking of detainable deficiencies to statutory certificates issued or endorsed by ROs will commence on 1 January 2026. The new methodology will then be implemented on 6 July 2027, using one calendar year (2026) of data, increasing to two calendar years of data (2026 and 2027) on 1 July 2028, and finally incorporating three full calendar years of data from 1 July 2029.
From 1 January 2026, detainable deficiencies began to be linked to the RO that issued or endorsed the relevant statutory certificate. The revised RO performance methodology will be implemented from 6 July 2027. Shipowners and managers should therefore cooperate closely with DBS to address deficiencies that may affect future RO performance.
2026 CIC OF PARIS AND TOKYO MOUs
From September 1st to November 30th, 2026, Concentrated Inspection Campaigns (CIC) focused on Cargo Securing will be conducted at Ports within the Paris and Tokyo MoU areas (other MoUs might follow same CIC during this time).
The Paris and Tokyo MoUs are expected to issue official campaign notification and checklist before commencement of the campaign.
For more information, please email psc@dromon.com
Copyright © 2026, Dromon Bureau of Shipping